Suppose you had the following question: What’s happening with yields and inflation in Sweden? Is there a similar story in the UK and US?
If you are not in the finance field this is not the type of question you ask yourself frequently, so naturally you do not have a dashboard that monitors this for you. To answer the question some options could be: searching for the answer online, downloading raw data and manipulate it with tools like excel or asking an AI model.
The latter option, e.g. using Chatgpt, seems like a good option for this question:
Downloading and manually manipulating the data is straightforward but takes time.
You could create a dashboard and make your code reusable but since the nature of the question is adhoc the dashboard might need frequent updating - tomorrow you might want to ask another question.
Searching online for other peoples’ answer does not allow for you to dig into to the question more deeply and ask follow ups.
AI therefore seems to be a good match because, at least on the surface, it promises automatic and effortless answers to all your custom questions. However it is usually notTHAT straightforward. While an AI agent works most of the time, the answer might be difficult to audit: what logic or code did it execute? what sources did it use for the data? did it transform the data in the right way? and so on. You may improve some of these things by creating better prompts but it still leaves things to be desired like consistency, reliability and interactivity.
agent tools and skills
To addres some of these issues you can create skills and tools for an AI to use. A skill is a text document with instruction on what and how to do something while a tool is typically associated with a piece of software like web search (allowing agents to search the web) or code execution (allowing agents to execute code).
Going back to the original question, we could increase the reliability of the answers if we gave the agent a tool to access data you trust along with instructions on how to search and query the data. This is in fact no different from the way normal people are given tools and instructions. It would also be great if we could audit what the agent did and interact with the data alongside the agent without having to re-prompt everytime we want a change - the right environment in which to use the agent.
Luckily for me (and others!) there is such an environment, it is known as Solveit1. Solveit focuses on the concept of dialogs in which you can talk to an AI, write and execute code and write notes - all in the same dialog. Solveit also allows you to view what the AI does, what tools it uses and edit the AIs response to better match what you want.
1 https://solve.it.com/
2 https://answerdotai.github.io/pyskills/
Now, since I am interested in questions related to economics, I created an ingestion pipeline and a database and exposed it as a tool to the AI within Solveit. For exposing the tool I used a module called pyskills2 (also developed by the team behind Solveit). I then went on to answer the question.
starting to answer the question
Here’s how answering the question looked like with an AI agent, my tool/skill (known as the macroeconomic-data skill or macroskill below) and Solveit. (Only part of the ai response is shown below)
Prompt: I want to investigate what is happening with yields and inflation in Sweden. How have yields and inflation changed recently and how does it look like on a longer horizon? Use your tools. Put useful information and graphs into variables that I can access.
ai response
“I’ll load the macroeconomic-data skill, inspect its API, then retrieve Swedish inflation and government-yield series at both recent and long horizons.” ①
import findata.macroskill; doc(findata.macroskill) ②
Tool call output ③
# module findata.macroskill:

"""Query macroeconomic series for inflation, exchange rates, and government bond yields.

Start with `available_series` rather than guessing identifiers. Each row includes the exact `series_id` required by `get_series`, together with its measure.

Once you have identified the series of interest, use `metadata` to look up important information. In particular, read the `unit` and `frequency` metadata fields before comparing series: rates and changes may be stored as decimals, while exchange rates use currency-specific units. Data may have different reporting frequencies.

The metadata contains information on: country, measure, source, unit, and monthly frequency.

Querying US headline CPI from January through March 2000 returns:

| period  | value    |
|---------|---------:|
| 2000-01 | 0.002971 |
| 2000-02 | 0.005924 |
| 2000-03 | 0.008245 |

This index contains monthly periods, while `value` field contains the observations. Data may be daily, monthly, quarterly or annual, check the frequency in metadata or by inspecting the index type of the dataframe.

"""

## functions:
- def available_series() -> list[tuple[str, str]]: ...  # List the series available in the database.…
- def metadata(*series_ids: str) -> list[dict] | NoneType: ...  # Return metadata for one or more series.…
- def get_series_df(series_id: str, start: str | NoneType = None, end: str | NoneType = None) -> DataFrame: ...  # Observations for one series, optionally within a date range.…
① The reasoning of the AI
② Python code execution invoked by the AI. Here it is looking up the documentation for my skill: macroskill.
③ macroskill is an ordinary python module. The documentation is text describing what the skill does and how to use it. Useful for both human colleagues and AI.
Note: In many contexts (e.g. chatgpt) this text documentation or instruction is known as a skill.
…
“The skill exposes discovery, metadata, and retrieval functions. I’ll inspect all three contracts, then identify the exact Swedish series rather than guessing identifiers.”
from findata.macroskill import*doc(available_series, metadata, get_series_df)
Tool call output ④
def available_series()->list: # `(series_id, measure)` pairs ordered by measure"""List the series available in the database."""

def metadata(
    *series_ids:str, # Series identifiers to look up
)->list[dict] | None: # Matching metadata rows, or `None`"""Return metadata for one or more series."""

def get_series_df(
    series_id:str, # Exact identifier returned by `available_series`
    start:str | None=None, # Optional inclusive first month in `YYYY-MM` form
    end:str | None=None, # Optional inclusive last month in `YYYY-MM` form
)->DataFrame: # Observation rows with `period` and `value` fields"""Observations for one series, optionally within a date range."""
④ The macroskill module contain python functions that can be executed. Again, these have clear documentation telling a user (a person or an AI) how to use them.
…
“I’ll filter the catalogue for Swedish inflation and government-bond yields, preserving the exact IDs and measures.”
⏳ py(code=“se_series = [(sid, measure) for sid, mea…”) ⏳
⑤ The AI has now read documentation on how to use the tool. It now calls the available_series function to check what data it can access, filtering the response for names related to Sweden. This is tool use, the tool is the function!
⑥ Here is what my database exposes for data related to Sweden.
From the above transcript you can see the key components involved in giving tools to an AI agent:
Documentation that describes how to use a piece of software (tool), including when to use it.
The software, function - the actual tool - in my case a python module called macroskill.
You can also observe the audit trail provided by Solveit. This transcript came from my dialog in solveit.
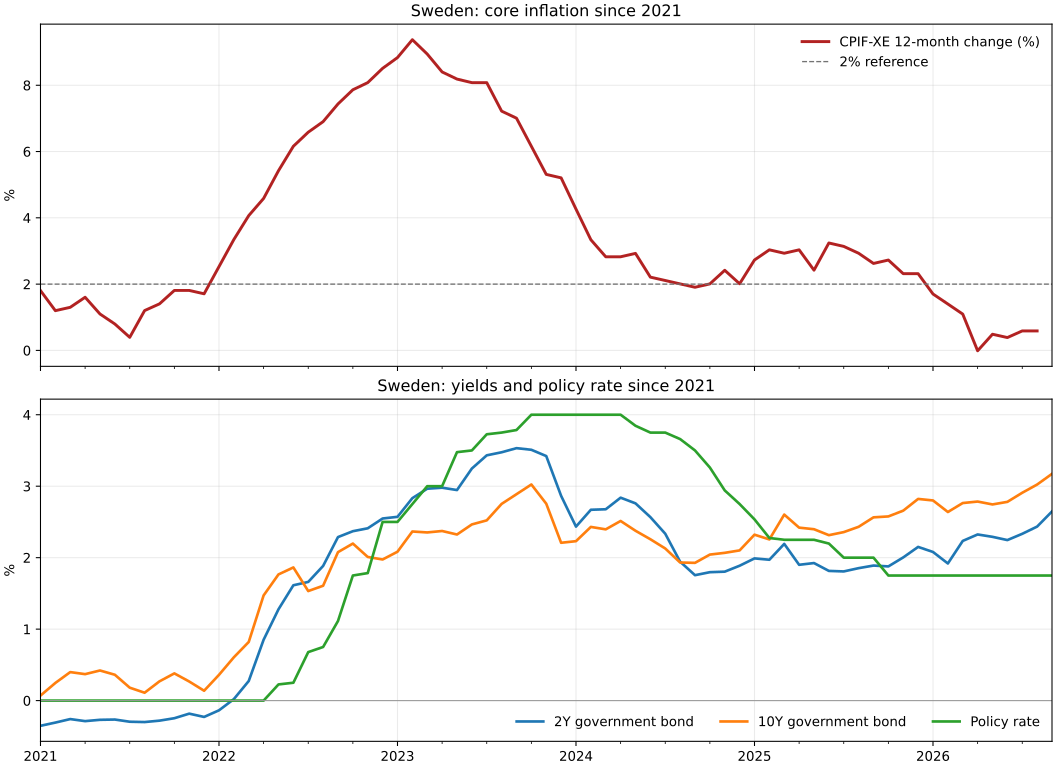
Having made queries against my database the AI agent went on to produce a few graphs showing inflation, yields and policy rates.
One of the graphs that the AI agent produced.
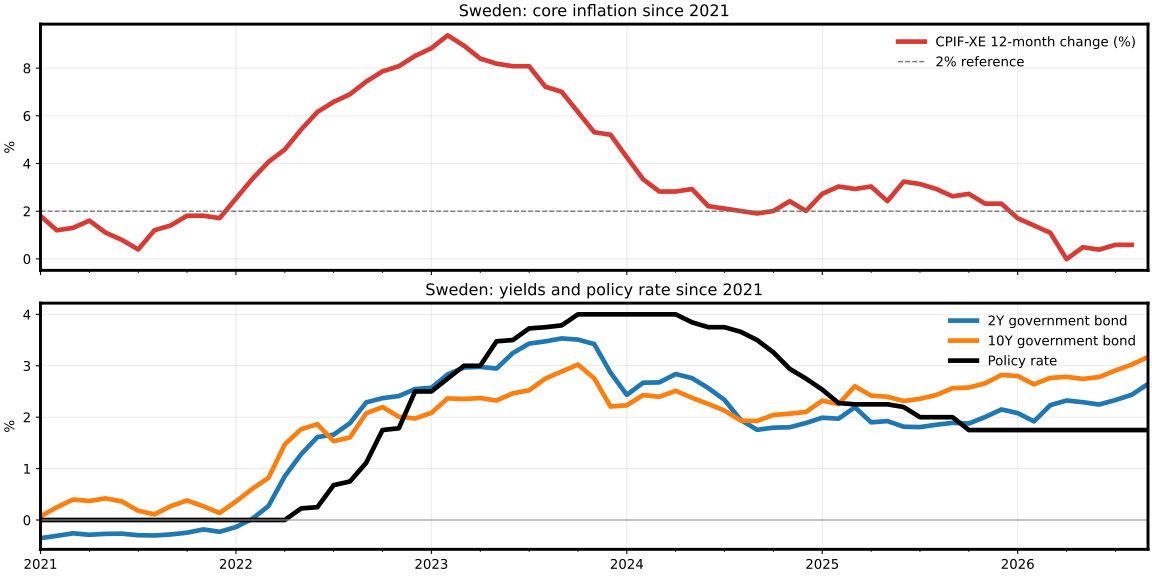
While the above plot was a great starting point I wanted to adjust the visual styling. Since the agent is connected to the same python environment in which I am writing and executing code I am able to directly access the output the agent produces.
In this case the agent had put the plot in a variable called se_fig_recent, I customized the plot on the fly using python code.
Show code
fig = se_fig_recentfig.set_size_inches(12, 6, forward=True)styles = {'CPIF-XE 12-month change (%)': ('#d83a34', 3.5),'2Y government bond': ('#1f77b4', 3.5),'10Y government bond': ('#ff7f0e', 3.5),'Policy rate': ('#000000', 3.5),}for ax in fig.axes:for spine in ax.spines.values(): spine.set_linewidth(2.2)for line in ax.lines:if line.get_label() in styles: color, width = styles[line.get_label()] line.set(color=color, linewidth=width) ax.legend(frameon=False, loc='upper right')
My custom styling of the plot made by the AI.
This demonstrates the value of an interactive and shared environment. I am able to edit the output of the AI directly without getting stuck in long prompt loops.
Prompt loop: Repeatedly tweaking prompts to make the AI fix a problem you could solve directly.
continuing the discussion
Having looked at the swedish market in isolation I made follow up questions for comparisons against the US and UK economies.
Prompt: Run the same analysis for US and UK. Show me yields and policy rates since 2021 like in the se_fig_recent. Also show longer horizon plot. Style the plots using my custom styling.
And…
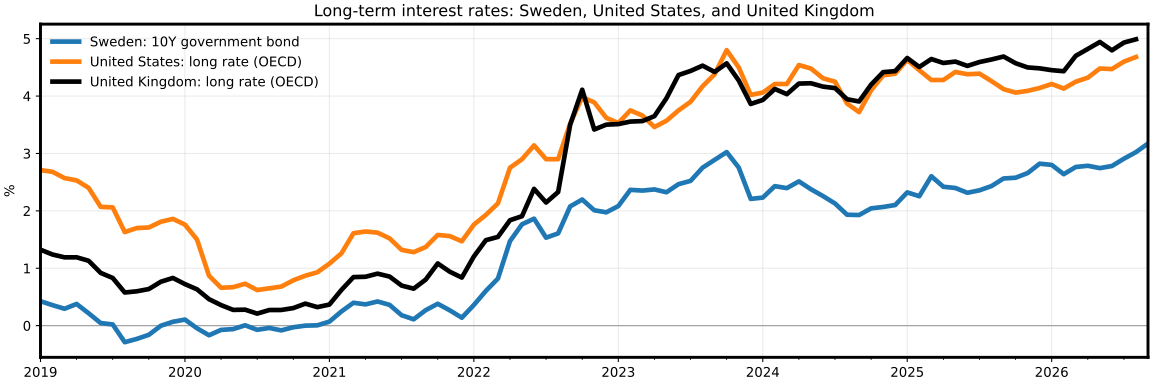
Prompt: Make a graph comparing all long rates (sweden, us, uk) from 2019 till now
The value of an interactive and shared environmente:
The agent and I share a common dialog, including code. The agent is therefore able to style its plots based on my earlier python code.
This plot was made by AI
The short term movements were clear, rates had gone up since 2020. I then wanted to take a broader historical perspective. Again, with the AI now getting accustomed to the type of information I was after this was just a quick question away:
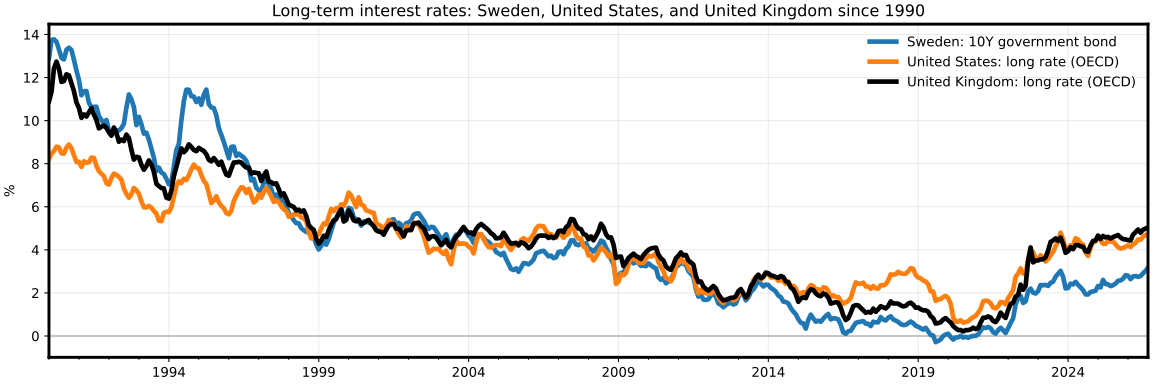
Prompt: Make a graph comparing long rates since 1990
This plot was made by AI
Looking at the bigger picture there has been a clear downtrend in rates since the 90’s and in fact rates in 2020 had been as low as ever. Rates were now up to levels more in line with earlier periods.
summary
By giving an agent access to a tool we can increase our trust in the answers the AI gives us. The data now comes from a trusted and verified source. Although not touched upon in the post, I have also found that tools with clear intent and the appropriate amount of flexibility makes an agent perform better - reducing flexibility can lead to more stable outcomes.
This post further shows the value of an interactive environment. An environment in which the AI naturally becomes your co-worker and partner than seeking to replace you. I was able to modify the plots it gave me, inspect and change the agent’s reasoning and add my own code and logic. I let the AI do the more repetitive tasks of fetching and transforming data. The solveit + agent + tool setup also allows me to quickly explore new questions that pop up. Here the value in AI lies in working with questions that are not already automated, questions that need exploration and iteration.